General Report (Dashboard)
The Overview page provides a comprehensive view of AIHive’s “health”. Here, you can monitor important metrics in real-time to evaluate operational efficiency and control costs.Key Metrics
When accessing the Overview section, you’ll see important metric cards:- Total Conversations: The total number of conversations that have occurred.
- Active Users: The number of unique customers who have messaged the Bot.
- Token Usage: The total number of Tokens (AI computing units) used. This metric helps you estimate API costs.
- Avg. Response Time: The average time for Bot to respond (in milliseconds).
- Satisfaction Rate: Based on user “Like/Dislike” reactions (if the rating feature is enabled).
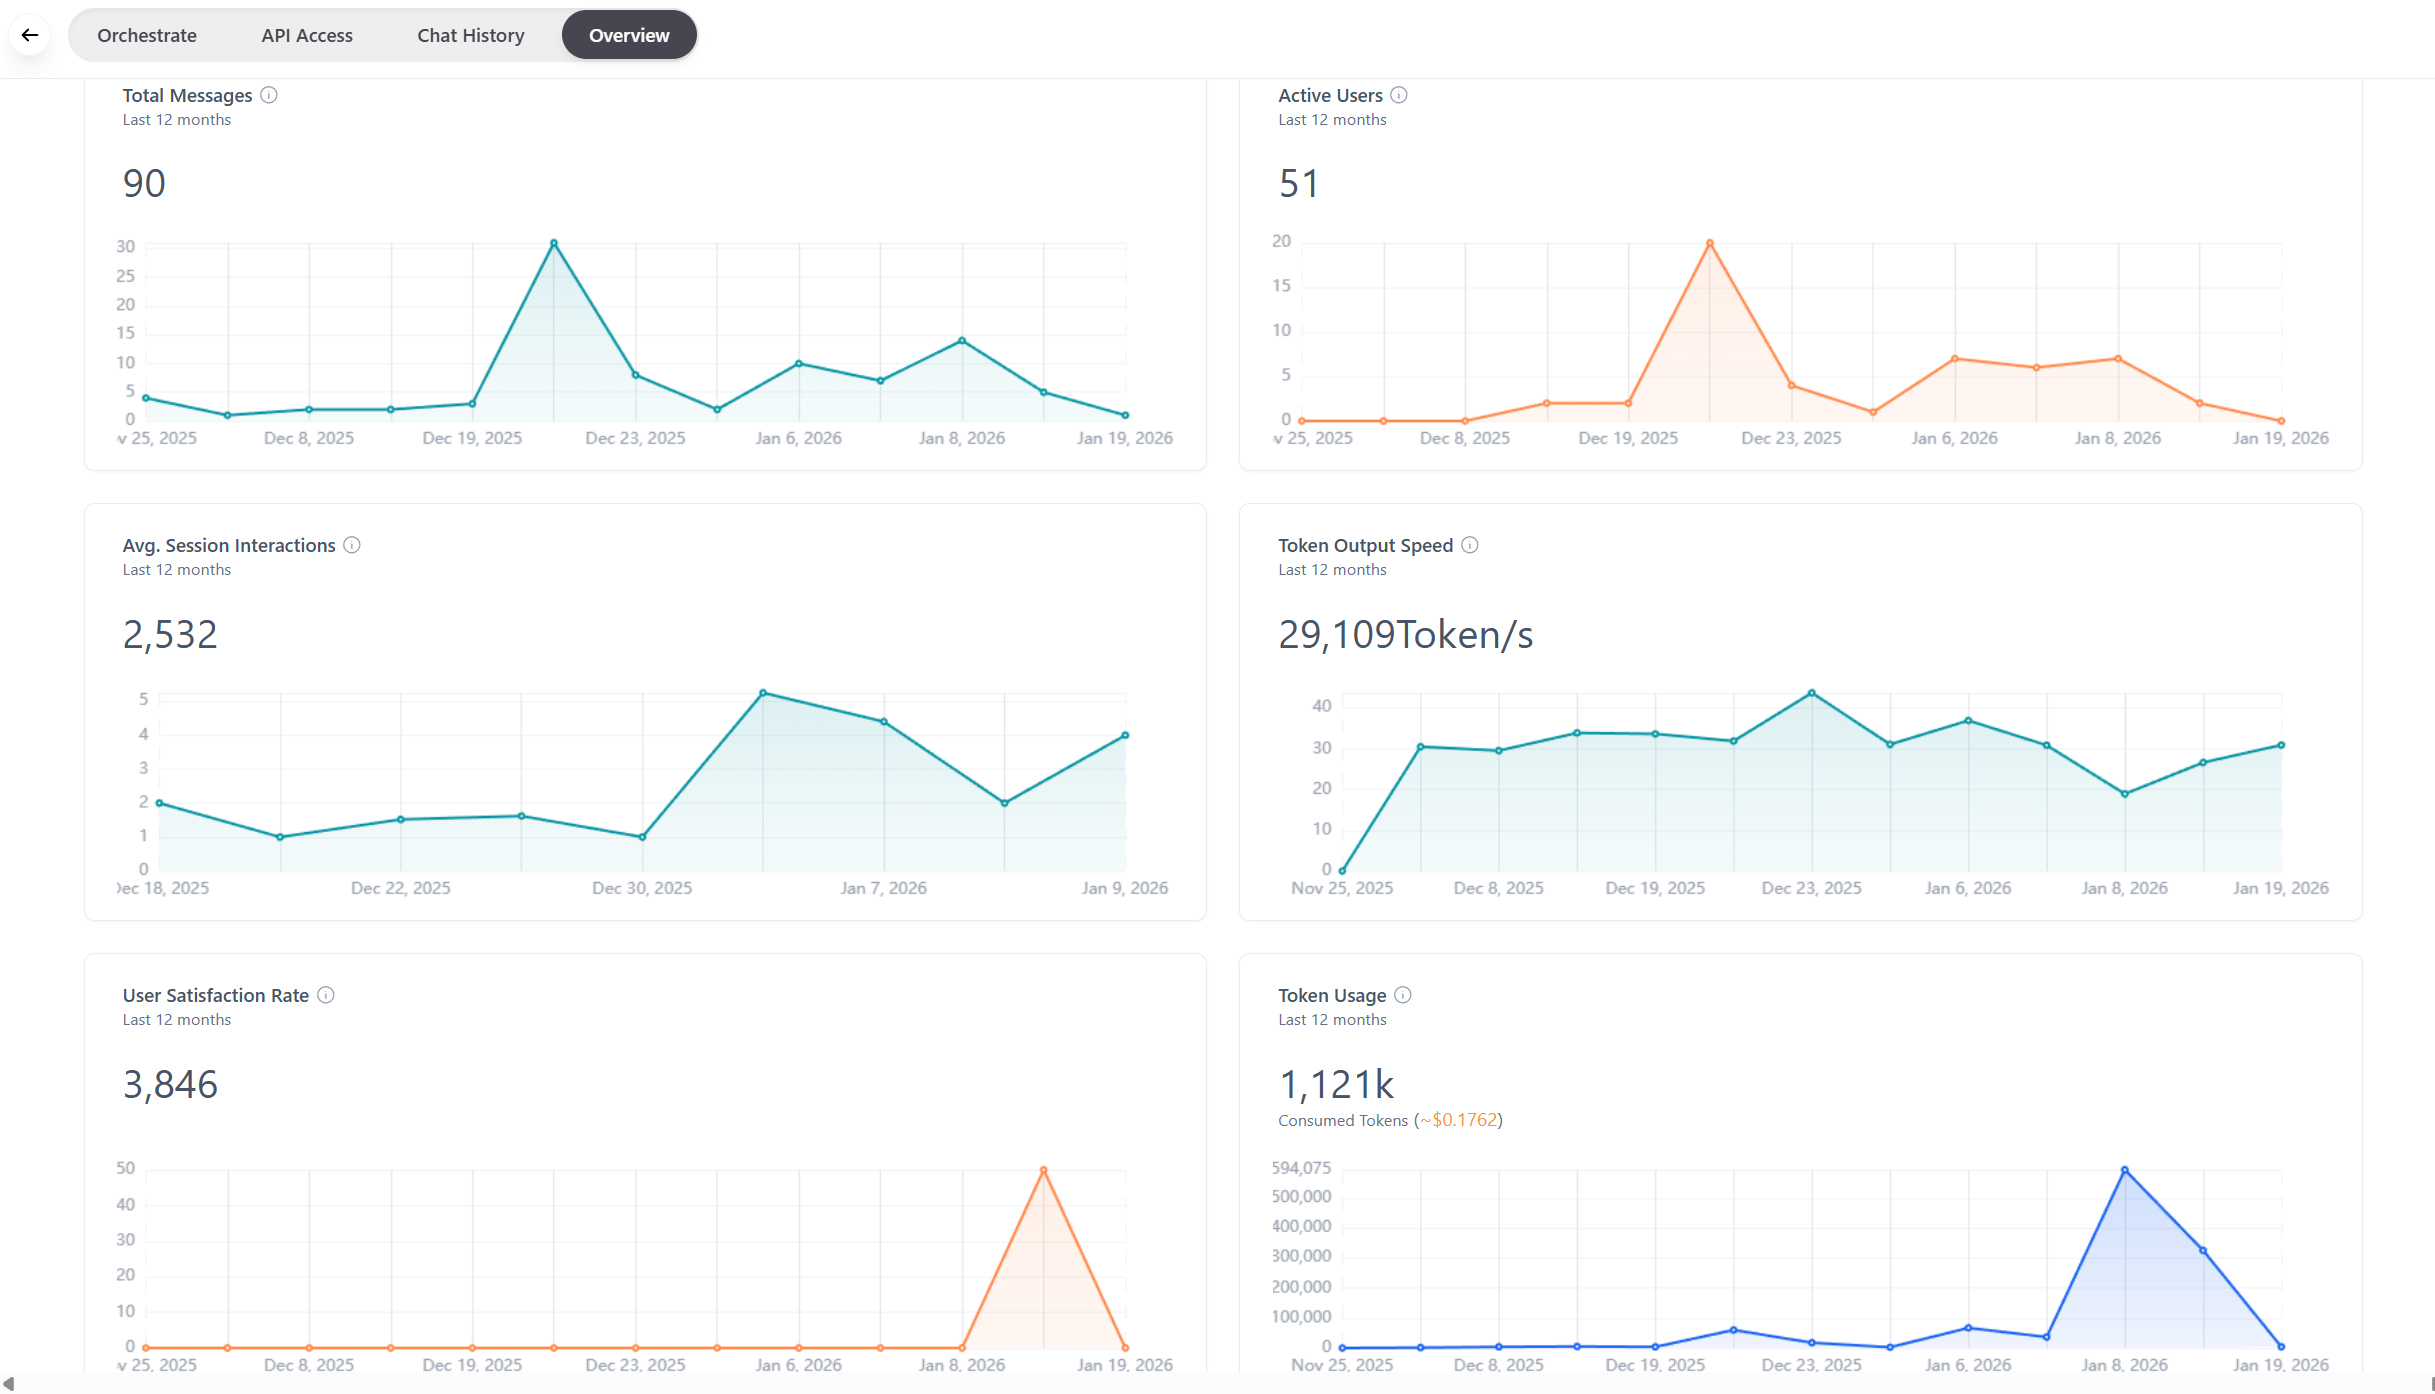
Trend Charts
The system provides visual charts for trend analysis:- Line Chart: Track message volume increases/decreases by day. Helps you identify peak periods (e.g., Sale days).
- Cost Distribution: See which Bot or Model (GPT-4 or Gemini) is consuming the most cost.
👉 Optimization Tip: If you see Token costs spike suddenly, check your System Prompt (is it too long?) or switch to a cheaper Model version (like GPT-4o-mini).